Midsize and three-row SUVs · model years 2014 to 2023
Ford Explorer vs Toyota Highlander: problems and reliability
On the 7 measures below that do not grow with sales, the Explorer looks better on 4 and the Highlander on 2, with 1 too close to call.
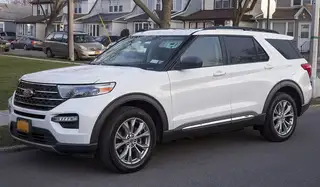
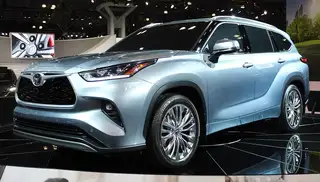
Newest report Sep 24, 2026 · checked Sep 27, 2026
Scorecard
| Measure, 2014 to 2023 | Explorer | Highlander |
|---|---|---|
| Complaints that report a crash | 2.2% | 5.9% |
| Complaints that report a fire | 0.5% | 0.6% |
| Complaints that report an injury | 2.3% | 4.0% |
| Median miles when problems are reported | 56,000 | 41,000 |
| Recall campaigns per model year | 6.7 | 2.8 |
| Do-not-drive recalls | 0 | 0 |
| NHTSA investigations | 9 | 0 |
The shaded side is lower (for miles, higher). Values within about a tenth of each other count as too close to call.
What owners complain about
The system Explorer owners complain about most is structure; for the Highlander it is transmission and drivetrain. Complaints citing structure make up 23% of all Explorer complaints, against 9.3% on the Highlander. The Highlander leans the other way on transmission and drivetrain: 28% of its complaints, against 12% for the Explorer.
Ford ExplorerToyota Highlander
Share of each model's complaints that cite each system, from NHTSA's own component codes. One complaint can cite several systems, so the shares add up to more than 100%.
The most reported problems
The most reported problem on the Explorer is windshield problems (9.4% of its complaints). On the Highlander it is brake wear (11% of its complaints), against 2.2% on the Explorer.
| Problem | Explorer | Highlander |
|---|---|---|
| Engine stalls or loses power while driving | 4.8% 503most in 2016 · 44k mi | 9.1% 245most in 2019 · 43k mi |
| Brakes grind, pulse or wear early | 2.2% 228most in 2020 · 24k mi | 11% 303most in 2021 · 25k mi |
| Windshield cracks or distorts | 9.4% 996most in 2017 · 77k mi | 2.8% 7522k mi |
| Transmission fails or needs replacement | 1.4% 148most in 2020 · 67k mi | 11% 289most in 2021 · 74k mi |
| Infotainment, screen or backup camera fails | 6.4% 682most in 2015 · 60k mi | 4.4% 11925k mi |
| Airbag warning light or recall | 2.7% 291most in 2016 · 60k mi | 6.3% 169most in 2021 · 23k mi |
| Transmission shudders, slips or shifts hard | 3.6% 382most in 2020 · 61k mi | 4.3% 116most in 2019 · 60k mi |
| Power steering cuts out or goes heavy | 7.6% 802most in 2014 · 70k mi | 0.2% 6 |
Share of each model's own complaints, with the count beside it. "Most in" links to the symptom sheet for the model year with the most reports of it, and the mileage is the median from reports that gave one.
When problems start
Highlander owners report problems earlier. Half the Highlander complaints that give a mileage come before 41,000 miles; for the Explorer the halfway point is 56,000. 44% of Explorer reports and 55% of Highlander reports come before 50,000 miles. Older model years have had longer to reach high mileage, so a window that runs to recent years pulls both medians down.
Ford ExplorerToyota Highlander
Share of the complaints that state a mileage: 5,693 for the Explorer and 1,188 for the Highlander.
Worst and best years
The 2016 Explorer draws 2.7 times the complaints of a typical Explorer year for its age. The 2021 Highlander draws 2.9 times the complaints of a typical Highlander year for its age.
Ford Explorer
Ford ExplorerToyota Highlander
Each bar is that model year's complaints for each year on the road, divided by the same figure for a typical year of the same model (the dashed line). Measuring each model against itself takes the sales gap between the two out of the picture, so they can share a scale. Years too new to judge are left out.
Recalls and investigations
The Explorer draws more recalls: 6.7 campaigns per model year against 2.8 for the Highlander. A recall counts once however many cars it covers, so this figure does not grow with sales the way complaint totals do.
Ford Explorer
67 recall campaigns and 9 NHTSA investigations across these model years. Most recalled: backup camera (11), transmission and drivetrain (9) and suspension (8).
- 25V-685 (equipment) covers 7 model years
- 24V-031 (structure) covers 6 model years
Investigations
- DP25001: Underbody shields detachment (closed)
- EA23002: Loss of motive power (closed, led to a recall)
- RQ23002: Rear axle bolt failure (closed, led to a recall)
Toyota Highlander
28 recall campaigns and 0 NHTSA investigations across these model years. Most recalled: equipment (6), electrical (4) and fuel system (4).
- 18E-107 (electrical) covers 5 model years
- 23V-720 (structure) covers 4 model years
Whether a particular car is included depends on its VIN. Check yours at nhtsa.gov/recalls.
Crashes, fires and injuries
A larger share of Highlander complaints report a crash: 5.9%, against 2.2% for the Explorer. Fire reports: 57 for the Explorer and 17 for the Highlander. Complaints on file report 2 deaths in the Explorer and 2 in the Highlander for these model years.
Ford ExplorerToyota Highlander
Share of each model's complaints in which the owner reported it. These are owners' own accounts as filed with NHTSA, and one report on its own doesn't prove a defect.
Questions
Is the Ford Explorer or the Toyota Highlander more reliable?
On the 7 measures below that do not grow with sales, the Explorer looks better on 4 and the Highlander on 2, with 1 too close to call. NHTSA complaint totals cannot settle it alone: the Explorer has 10,584 complaints and the Highlander 2,700 for model years 2014 to 2023, and those totals follow how many of each were sold.
Which has more recalls, the Explorer or the Highlander?
The Explorer has 67 recall campaigns and the Highlander 28 across model years 2014 to 2023. The Explorer draws more recalls: 6.7 campaigns per model year against 2.8 for the Highlander.
What are the most common problems on the Explorer and the Highlander?
The most reported problem on the Explorer is windshield problems (9.4% of its complaints). On the Highlander it is brake wear (11% of its complaints), against 2.2% on the Explorer.
More comparisons
- Toyota Highlander vs Honda Pilot2014 to 2024
- Ford Explorer vs Chevrolet Traverse2014 to 2026
- Ford Explorer vs Kia Telluride2020 to 2025
- Hyundai Palisade vs Toyota Highlander2020 to 2024
- Kia Telluride vs Toyota Highlander2020 to 2024
- Nissan Pathfinder vs Toyota Highlander2014 to 2023
- Dodge Durango vs Ford Explorer2014 to 2026
- Jeep Grand Cherokee vs Ford Explorer2014 to 2026
- Jeep Grand Cherokee vs Toyota Highlander2014 to 2024
- Subaru Ascent vs Toyota Highlander2019 to 2021